
- +91 9503666660 / 9823123633
- ☰
- Home
- About Us
-
Products
Global Mapper Global Mapper Pro Digital Elevation Data Drone/UAV Agisoft Metashape
(Formerly known as PhotoScan) Surfer GEO5EnviroInsiteGeographic Calculator GMS | SMS | WMS MAPublisher Geographic Imager Final Builder- Services
- Contact
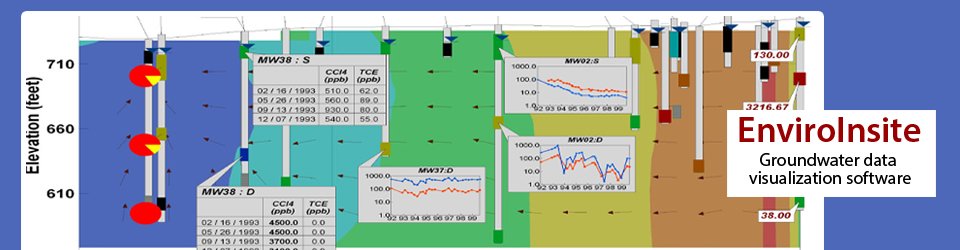
EnviroInsite - Groundwater Data Visualization
EnviroInsite is an environmental data visualization application used for geo-enviromental applications. It is used by geologists, hydrogeologists, and engineers. EnviroInsite is far more than just GIS.
Its powerful features includes Piper diagrams, Stiff diagrams, and Schoeller diagrams which enables you to analyze geochemistry.
Fence diagrams, strip logs, and geologic modeling enable understanding of the hydrogeologic setting.
Beyond that, georeferenced radial diagrams, Stiff diagram, pie charts, 3d surfaces, and particle tracking afford you tools to better understand the complex spatial and temporal relationships in your environmental data.
Mapping
- Shapefiles
- DXF, DWG
- BMP, JPG, TIF, PNG
- Web Mapping Services
- Bing Maps
- Coordinate Conversion
- Georeference Images
Contouring Features
- 2d plan contouring
- x-section contouring
- 3d contouring
- Clip 2d contours to polygon
- Kriging, inverse distance interpolation
- Incorporated volume estimation
- Optional manual label placement
read more read more Geology Features
- 3d Fence Diagrams
- 3d Boreholes
- Boreholes on X-Sections
- Strata Modeling on X-Sections
- Contact Elevation Contours
- Strata Thickness Contours
- Customizable Strip Logs
Geochemistry Features
- Conventional Stiff Diagrams
- Mapped Stiff Diagrams
- Piper Plots with Labeled Locations
- Schoeller Diagrams
- Durov PLots
read more read more Environmental Forensics
- Radial Diagrams
- Linear or Log Scale Axes
- Pie Charts
- Scaled by Total Value
Charting Features
- Georeferenced Charts
- Tiled Charts
- Trend Lines
- Plot Standards
- Multiple Axes
- Box Plot Charts
- Wind Rose Diagrams
read more read more Boring Log Features
- Easy-to-use design window
- Data-driven
- PDF export
- Flexible data structure
- Reusable template files
Data Table Features
- Plan and X-Section
- Cross-tab or List
- Transpose Option
- Cell Formatting
- By-Depth Option
- Detections-Only Option
- Exceedances-Only Option
- Automated Placement
- Translucent backgrounds
read more read more Data Management
- Tables are linked based on common features
- Data can be stored in Excel/Access
- Queries can be used to generate graphics
- Query and object properties saved to xml file
Generating Output
- Copy to Clipboard
- Save to image file
- Save vector File (DWG, DXF, DWF, PDF, DGN, SVG, EMF, SHP)
- Print to any windows supported device
- Generate Layouts, Templates
read more read more